Showing posts with label silver. Show all posts

Thursday, September 15, 2011

Silver Possible head & shoulder


Silver is making a potential Head & shoulder Pattern with neckline near 39.5 $ , if we see daily close Below same for next two three Days we could See a sharp Fall till 35 $ , The importnat 55 DMA is also near 39.5 $ a improntat place to watch . Looking at the wave Counts we still have the Same previous bearish counts open with cureent move as 1 of 3 of c with Final targets till 29 $ 


For Regular quick updates Follow us on twitter 
www.twitter.com/askchirag


For Intraday updates join our Yahoo group
http://finance.groups.yahoo.com/group/askchirag/

For Personal Assistance / Sales queries/ 
Add yahoo id chiragkb5

Sunday, August 7, 2011

Gold & Silver Charts , Gold Could be near a short term top

Gold Makes a Run away , Exhausation gap at open today and manges to Cross the Longterm weekly Resistance of 1684 which was very Crucial level For bears , Expecting  high Volatility in Intraday Now coz of short Covering Which can take prices up will 1707--1716 , which Co-incides with wave Levels of 5=1 . A Failure to close abv 1716 Could be indiaction of Medium term top in Close and Push Prices DOwn till 1525 which would be 23.6 % retracement of Complete Move of decade , if we C the Prices pushing Higher abt 1716 could be a extended 5th which can go higher till 1781 than


Silver : Explanation on Charts

Thursday, May 12, 2011

Silver update


Silver Looks to have Completed 5 waves down From Recent High of 49.7 & looks like time For Seriously Sharp Pull back , if the 5th wave gets extended Breack of 32 $ would be a confirmation of same , than Can Extend till 28.4 ..but When we Look at other Precious metals Charts Along with it Should See a bottom near these levls and again pull back to 44 Levels in coming days 

Tuesday, April 5, 2011

#Silver medium term view

Looking at silver weekly charts for past decade the rally which started from almost 3.50 $ to current price of 38.5$,it clearly looks likes near end of extended massive bull run of 5 waves and now could get into corrective phase (wave 2 a-b-c ) for next few months. Any new high on silver would be a good sell opportunity or a break of 36 dollar would confirm a medium term top and we could look at short term downside targets of 32.5 $ and 27 $

Snapshot :

#silver break of 36$ could confirm a medium term top & correct down till 32.5$ and than 27$ , $slv , Good sell on rise #askchirag any new highs or rallies good setup to create shorts

Wednesday, March 23, 2011

#copper , #gold , #silver Trading Levels For short term

Copper (MCX) Looks Strong -- till time prices holding the Key Level of 430 --- One Can expect An Further upside till 442--445--449  , Downside Below 430 Support at 426.5 ---410

Gold  & silver Faceing Resistance near Previous week's high on Comex , a Sustained trade Above Same Can Push prices Further up on Gold till 1447$ --1465 $--1489 $ and on Silver 36.5 $---37.2 $--38.4$
On downside Important Support on Gold now at 1415 $ & silver 35.2 $

Wednesday, March 2, 2011

#Silver Near medium term channel Resistance


Silver Will Face Strong Resistance near 35.1 $ lvls which is upper end of medium term Channel .Its moving in  channel From Lows of 18.6$ . The weekly RSI is also overbought and currently trading abv sub 75 lvls . Once can expect a short term top to be in place at 34.96 lvls and expect some Sideways consolidation to Downside . The immediate important Support Now is at 31.25 $, a Close below same can lead to Further Correction till 28$

Thursday, January 13, 2011

silver short term update


silver


Silver has formed a short term top at 31.15 $ and looks like has started to correct down in set of 5 waves with the first wave over at 27.7 $ and wave 2 at 29.8 , the third wave looks like headed for sub 25 levls . With Final target of 22.4 (wave5)

Tuesday, December 14, 2010

Gold Silver Update


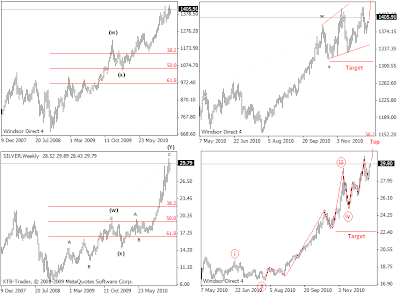
Unlike Gold, Silver seems to be completing a final v subminor up. This seems to be a completion of the leg up from Nov 2009. And considering the large exponential blow off that we illustrated prior and Silver topping the Jiseki rankings we continue to look at any leg up on Silver now as the last leg after which the white metal should fall back into 22.40 previous iv wave supports. Gold also seem to be in the final Y minor leg up and should follow silver down.

Done in association with orpheous Asia Intraday Service (Ticks Global)

Tuesday, November 23, 2010

GOLD.SILVER.DOLLAR.OIL


Gold has a clear five wave impulse down. The B wave should end near 1,380 levels after which the C wave down to new lows below 1,320 should begin. Silver looks more like a 3-3-5 structure. We see the B wave complete and prices starting a C leg lower till 25. OIL is also stagnating in a B wave, which should resolve lower. Dollar index remains in B wave till price clearly move above 79.55 previous highs.
(Article written in association with Orpheus CAPITALS -- ticks Global Intraday Service)

Tuesday, September 7, 2010

Silver Short term view


Silver Short term : Silver is Highly overbought Zone , and has made A hanging man Candle Stick reversal pattern Near Resistance Level of 20 $ . In Short term , Shorts Can be Taken with Sl above abv 20 $ on closing basis , for Down Side Targets of 19.3 $ & 18.9 $

Tuesday, June 15, 2010

Silver Short term view

askchirag.com : Silver view short term :

Everywhere People are Talking about the Massive Head & shoulder formation in Silver comex on daily charts which is a Bearish pattern and Silver Could Fall Down to 14.25 levels But technically speaking The massive breakdown Will come only If silver trades constantly below 18 $ and than breaks the important Support level of 17.05 $ (Neckline of head & shoulder pattern) , A Break below 17 $ will Confirm the above Pattern and open Downside targets till 14.25 $--but Contradicting to above pattern it has formed a massive Inverted head & shoulder pattern With Neckline near 18.75 $ , a break above Same can open upside targets till 19.8 $--21.44 $
So overall currently trading at 18.55 $ technically its in a neutral zone and next big move would Only happen if manges to close above 18.75 $ or break below 18 $ till than would be Range bound
Looking at RSI charts its constantly reversing From 40 Zone which generally tends to Happen in bullish phase So looking to Trade it more buy on dips till time 18.00 $ is not Broken

Short term Reco : Buy silver at 18.5 $ SL of 18 $ Look for 19.8 $--21.44 $

Friday, February 26, 2010

silver


Silver has been moving in a Expanding triangle and wave count shows a Possible Start of third Wave with EURO also Supporting as far 15.65 Holds on closing Basis one can Expect an upside target of 17.55 lvls

Thursday, February 25, 2010

Silver Comex


Possible Wave Count on Silver

As Far 15.65 is Held on Downside One can play longs For Trgt of 16.05--16.2

Thursday, November 12, 2009

Comex Silver Short term view


What Next On Silver ???


Case a) marked With Pink Round Arrows Showing possibility of making of head & shoulder pattern case b ) Marked with orange arrow --- big Move & flag bullish flag consolidation


Case a) Silver If breaks 17.1 than a strong case of it forming Head & shoulder pattern over short term arises ..with neckline at 16.35 & breach below Same Would open an downside target of 14.1
Case b ) Shows that silver is consolidations Mood up after the large up move From 16$ to 17.75 $ and would breakout Soon ..any close abv 17.8 Would open upside Possible targets of 18.4--19.6


Summary : So the Most important lvls For Silver in short term are 16.35---17.1---17.8--18.4
While 17.1 indicating breakdown of Flag and test of Neckline at 16.35 possible & close abv 17.8 would mean that the short term Bullish Trend is still continued

Thursday, September 3, 2009

Silver Technical Analysis Short term view

Silver Short Term view , Approching very important Resistance Zone


Silver Short Term view
Comex Silver: Silver Rallied quite sharply to retest the First Resistance zone of 16.22 which was high made in last week of May and Recent intermediate top. From where Silver fell Down to make a higher bottom at 12.50$ and again bounced back Sharply to re -test Same levels , Over the Short term once Silver Crosses 16.22$ it would be Entering the half unfilled gap which it had attempted to Fill in the month of may and Failed and this Second attempt on same . the Gap which is From 16.84$ to 15.44 $ created during downfall which started in August 2008 month, the Zone 16.22$ to 16.84 $ has Many intermediate Resistance in between which are very important once and can be a Strong resistance Zone firstly 16.35$ which is 61.8 % Fibonacci Retracements level of Complete Downward move Which Started From the top of 21.30$ to the lows of 8.44 $ . A Close above 16.36$ S Would clearly mean that the Complete correction from 21$ to 8.44 is Over and Silver again Ready to re-test the Recent highs and Even surpass Them in the medium term . Next Resistance in between is coming up from the trend line which is a Rising upward trend line connecting the Highs of gap made in August month to the May top which is Cuming around 16.4$ levels . So overall will have to Wait and Watch how Silver manages to trade in this Complete Resistance filled zone of 16.22$ to 16.84$ . A Firm close above 16.84$ would Mean that silver Is getting ready For Medium term bigger up move With Next possible targets at 17.8$ & 19.12$ in the near term . Looking at the lead indicators silver is currently at resistance Cuming from the weekly Bollinger band and On Daily charts has crossed the upper band with great Strength indicating that could soon get into a consolidation phase for few Days before making fresh up move or Next move. The RSI daily charts is near 74 almost approaching the upper end of Overbought Zone (Please note: a Stock or commodity Can continue it’s up move though the indicators are in overbought zone for Long time).The MACD is still in Buy sign Zone

Wednesday, August 26, 2009

Silver Short term technical view 260809


Silver made a high of 24250 in second week Of august later on fall sharply downwards to 22500 which was strong medium term support to Bounce back sub 23400 level , the Complete retracement was in a form a Channel which has height of almost 650 Points . Looking at different possibilities over short term and Patterns visible

case a) medium term trend Shows that the retracement was in Form a channel and Now will face strong resistance in the Zone of 23600-23750 Zone, a strong momentum close above the said levels can open upside target of 23750+ 650(channel height) i.e. 24400 .


Case b) If unable to Cross the resistance of 23600-750 and falls back to re test the support near 23250 and a Breach below same would open possible Downside targets of 23250-650 (channel height) i.e. 22600 and Over larger trend Possible downside targets of 21850-22100 .. Possible Extension of Previous Move


Important Levels : 23210--23265 Zone Downside
23600-23750 upsdie
Chart analysis : case a) marked with pink arrows
case b) Marked With yellow arrows
Channel marked with blue Lines

It is Safely assumed that you agree and Abide with Disclosure & disclaimer mentioned on website www.askchirag.com
Wednesday, July 8, 2009

Silver Technical Analysis 8th July 2009


Silver Currently trading at 12.95 $ , had broken the important medium downward Trend line coming up from the recent lows of 8.44 $. The break-down level was 13.25$--13.35$ . On Daily Charts after closing taking Support at 12.97$ the Short term Support it Reversed back to Re test the Support which was broken and it acted as String resistance. Breaking below 12.97$ again . The Yellow trend line on Chart is Medium term trend line & Red Horizontal Line Shows the 12.97 $ Support
Looking at Intraday 15 Min Charts , a Evening Star & gravestone Doji Were Clearly visible , Signally that its Facing Strong Resistance at 13.15 $ levels and Inviting Fresh Shorts

A Close below 12.97$ Would Initiate further selling pressure Which Could drag Down the prices to 12.68$--12.54$--12.25$ Over Next few Days--week